Unpacking The Data – An Analysis of USGS Workflow

Foreword

As an avid outdoor sports enthusiast, including white water kayaking, search and rescue work, winter hiking, rock climbing, and others, I can assure you one of the most important aspects is preparation. Of course, this includes physical training and proper equipment, but much of the skill is in awareness, and that means monitoring conditions like weather and streamflow.

In the latter case, there is also an ethical and conservation aspect, in that a passing review of runoff and flow indicates the health of a stream, and by extension the environment around it, up to and especially climate.

Noting the above caveats, I have selected the United States Geological Survey Streamflow, computed runoff for water years within the Commonwealth of Kentucky as a target setting for analysis. This data is updated in real time and available at the USGS site here.

Selection

United States Geological Survey Streamflow – Computed Runoff for water years within the Commonwealth of Kentucky

The United States Geological Survey (USGS) is a scientific agency of the U.S. government established in 1879 with a budget of 1.6 billion USD (H.R.2617 – 117th Congress, 2021-2022). Employing over 8,600 staff, it is tasked with studying natural resources, natural hazards, geology, geography, and the impacts of land use and climate change on these systems. It conducts research, monitors, and provides data on earthquakes, volcanoes, landslides, water resources, ecosystems, and mineral resources. The current USGS motto “science for a changing world” succinctly informs this purpose.

The USGS plays a crucial role in informing policymakers, resource managers, and the public about the Earth’s dynamic processes and how they affect society and the environment.

Collection

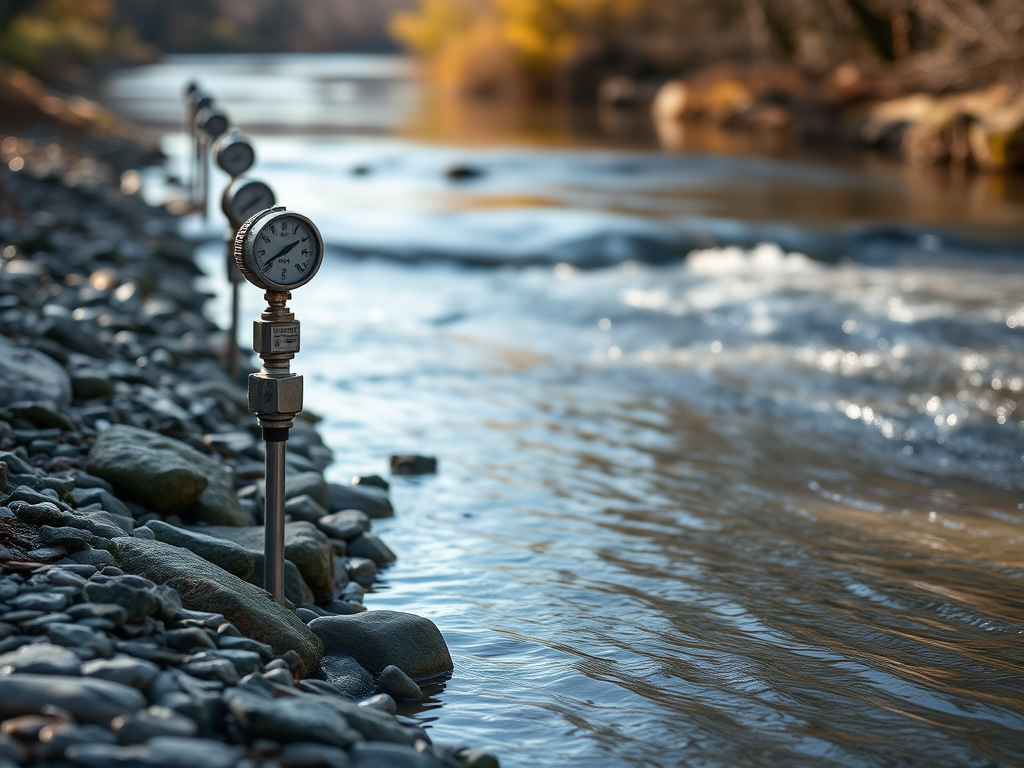
For water measurements, the USGS primarily relies on a series of automated stream level gauges placed at strategic points along waterways. The technology in use has remained unchanged since its inception, with only transmission and recording devices evolving to take advantage of digital storage and networking (Nielsen & Norris, 2007). Each station utilizes an air pump connected to a small hose routed to the stream bed. At regular intervals (typically every 15 minutes) throughout each day, air is forced into the hose, equivalent to blowing bubbles through a drink straw. As water depth increases, there is an equivalent increase in water pressure, and thus resistance to the airflow. Measuring the air pressure required to overcome this resistance produces a depth value. In turn, comparing depth to a cross section of the stream at point of sample enables a flow rate calculation. This technology may seem primitive or overly complex (why not just use a float or sonar gauge?). However, it offers distinct advantages over other methods:

  • Robustness – The compressor, recording, and transmission equipment can be mounted safely out of the river’s reach in a single, sturdy housing. This eliminates the need for immersed mechanical devices that quickly clog or degrade and protects more sensitive components from damage during large flow events. It also enables easier maintenance access by moving the housing unit close to or directly adjacent to nearby roadways. Additionally, the only exposed component (the hose) is self-maintaining by nature of its operation. Further resiliency is added by including a battery backup, ensuring continued measurements during extreme weather events.
  • Accuracy – Unlike a fixed gauge that may overtop or “bottom out,” there are no practical limits to measurement. Heavy floods or severe droughts do not affect operation.

Flow rates are typically expressed in cubic feet per second (cu ft/s) or cubic meters per second (m3/s), with one cubic foot equal to about 7.5 gallons, and one cubic meter equal to 1,000 liters (about the volume of a large refrigerator). These measurements can then approximate the total runoff in a particular area.

As an example of scale, consider the Licking River. Notable as the primary in and outflow of Cave Run Lake (Cave Run, 2023), this tributary of the Ohio River is a medium sized waterway at 488 kilometers (about 303 miles) in length with a basin of about 9,600 km2, covering most of the Gateway and Cumberland Plateau regions of Eastern Kentucky. At Alexandria Kentucky (just upstream from its confluence with the Ohio across from Cincinnati) the Licking produces an average discharge of 162 m3/s (United States Geological Survey, 2024). That is enough to fill an Olympic sized swimming pool every 20 seconds, or if we assume a modest head of 20 meters, a force equivalency of approximately 3.2 million watts (~4,300 horsepower). Equal to about 2,600 households or a large diesel locomotive at maximum tractive effort.

Kentucky presents a challenge by volume; in that it possesses the most running water of any contiguous state (it is only surpassed by Alaska). However, the methodology does not change. Kentucky’s measurements are taken from 258 stations placed throughout the commonwealth, providing a granular assessment of each of its major watersheds. All of which are in turn part of the Ohio River watershed, other than a small western area that drains directly to the Mississippi River. Note that the Ohio River is not only the largest tributary of the Mississippi River, it is over 25% larger in volume than the Mississippi itself at their confluence (average discharge 7,960 m3/s vs. 5,897 m3/s). This means in terms of hydrology the Mississippi is the tributary and the Ohio River is the true main stem of the Mississippi River system (Van der Leeden, Troise, & Todd, 1990), making all of Kentucky’s major watersheds (i.e., the previously noted Licking River) a second-tier oceanic drainage, and thus having long reaching environmental ramifications.

Data

Data is presented in a simple table layout. Each data point (a row) is expressed as a water year, starting from 1912 to the present date. See sample below:

RegionYearRunoff (mm)Runoff (in)RankPercentile
KY1901578.2422.773175.00
KY1902536.8521.144464.52
KY1903694.8327.361191.13
KY1904331.5313.0510416.13
KY1905346.6613.659820.97
KY1906471.9418.587043.55

From each water year, the total runoff is provided in millimeters and inches. The data is very straight forward, being a direct quantity measurement. I was briefly confused by the fields for rank and percentile, in that no context is provided (rank vs. other states, projected totals, etc.). However, it quickly becomes apparent the percentiles and ranks are measured against other water years. This provides a quick glance at which years are wetter, flood prone, or experienced drought.

There is no historical author given, nor any data available prior to 1912. This, and the simple measurements, suggest that the format has remained unchanged since initial creation, and that it is the product of several generations of staff.

Comparative

As the USGS is a national organization, it is necessary to find an organization beyond the USA borders to locate a similar collection that would not be outright identical. In this case, the United Kingdom provides us a comparative source of data though the National River Flow Archive (NRFA, 2024). The NRFA does not enable downloading of regions as the USGS does, instead requiring selection of individual station data. As seen in the sample below, the data does not include a ranking or percentile calculation, though we may acquire these manually.

DateRunoff
1890-01-010.1
1890-01-020
1890-01-03 2.3
1890-01-042.8
1890-01-053.4

One markable difference is the granularity of data points. While the USGS aggregates runoff by water years, the NRFA breaks data points to each day of each month.

Uses

The USGS is itself a government agency and is often cited by other agencies for statistical data. An example of USGS data in use is drought analysis performed by the Environmental Protection Agency (Drought, 2023). In this example, the EPA uses a visualization to highlight areas with dramatically reduced runoff:

From this visualization, it becomes apparent that an alarming portion of the United States is experiencing reduced stream-flow and greater severity of water shortages.

Ethical Issues

Other than potentially misleading use of statistics by other entities (ex. omission of nearby regions that experienced increased runoff in charts promoting drought awareness), I was unable to find any ethical issues within the data. Stream flow and runoff are firmly established as public interests and are not physically concealable data. Collection efforts are largely automated, eliminating human elements other than analysis. While the data may be affected by human activities, it is not feasible to relate to a single individual or group.

Contextual Interview

Peter J. Cinotto
Branch Chief for Operations
Associate Director – Kentucky
USGS Ohio-Kentucky-Indiana Water Science Center

As is likely apparent, no one person is responsible for the USGS’s 100+ year country wide continuous data collection. Also, given the USGS is a large and fully bureaucratic agency, I was not confident I would be able to secure an interview within the available time frame (for this reason, I had prepared a standby data set and interview subject).

However, starting with a general missive to the USGS national information contact, and bouncing from several points (all of whom I note were quite affable and helpful), I was eventually able to secure an on-site interview with a Mr. Peter Cinotto, Branch Chief of Operations for the tri-state (Indiana / Kentucky / Ohio) regional office. Mr. Cinotto holds a Master of Science Degree in Geology from the University of Colorado, with a 30-year background in the USGS, and an extensive prior career as a well technician in various Texas oil fields. Mr. Cinotto continues to undergo professional development training at the USGS, much of it centered on in-house technologies and procedures.

Mr. Cinotto did not just provide his valuable time and insight for the interview. He also gave me an extensive tour of the lab and a look at the various instruments, fleet vehicles, submersibles, and other field equipment. All told, I spent over four hours on-site, and would have stayed longer were it not for another looming commitment. In truth, I learned far more from the tour and informal discussion after the interview than in the interview itself. This aspect is not particularly surprising, and that is why I would always recommend going on-site and developing a good rapport whenever possible.

One of the most intriguing aspects of the interview was discovering just how “open” the USGS is as an agency. I was already aware of the public data, but I was not aware at all (and quite shocked to learn) of the almost uncountable coding and technical developments they spearheaded, and then made open source:

  • High fidelity acoustics (now found in home and concert audio).
  • Statistical models.
  • Various unmanned surface and submersible devices.
  • Wide distribution real-time satellite transmission.

For the “official” portion of the interview, I utilized the provided questionnaire, and added a few of my own. Part of the skill of an interview is “reading the room”. It was obvious Mr. Cinotto would be more amenable to an informal approach, and so within the bounds of the questionnaire provided that is how I elected to comport myself.

Interview Recording

Interview Questionnaire Summary 

Q1 – What is your role and/or relationship to the data? – 00:54

  • Ensure that USGS Louisville tri state office (Indiana / Kentucky / Ohio) collects defensible stream and runoff data. Engage with stakeholders (civilian public, stage agencies, Army Core of Engineers) to ensure process and data are meeting their water resource management needs (flood protection, water supply, water quality).

“Whatever the case is, it is my job to ensure they have defensible data to do that with.”

Q2 – What training or experience helps you interpret the data? – 02:15

  • Master of Science (Geology).
  • 30-year background in well management from oil rigs.
  • USGS provides continual professional development training for all staff.
  • Environmental Statistics.
  • Electronics / Hardware construction.
  • Coding / Database.
  • Field procedures and safety.
  • Geology.
  • USGS has created many of the measuring techniques and modeling procedures in house, and so staff have instant access to problem solving information when questions arise.

“So if I have a question in statistics, I can call Bob Hurst who literally wrote the book on it, and he would, has spent an hour with me.”

Q3 – What would you like people to understand about the data and how to use it? – 04:53

  • All USGS data is publicly available, all the way to the first measurements taken in 1888.
  • Long term, highly granular (samples taken in 15-minute intervals at the longest), continuous data enables modeling long term trends that resist short or even generational term analysis (i.e. Climate change).
  • Scientists online are available to convert data into useful information.

“If you’re going to, say, look at climate change, a lot of times looking at these decadal cycles you need fifty years of data just to get at that. We’re one of the few people in the world that has the ability to go back and have continuous, defensible data sets to allow you to do that.”

Q4 – What kinds of errors can people expect to find in the data? – 07:10

  • As the USGS is a primary data source, multiple redundancy procedures are in place to ensure final certified data is error free. However, real time “provisional” data available online may contain errors from sensor maladies that are later corrected or omitted during data certification process.
  • Sensors must meet extremely stringent requirements for time series data.
  • Less stringent applications are allowed for high tolerance binary data (is this road flooded, yes/no).

“Anything less than 4 millimeters (in accuracy tolerance) is not approved for collection.”

Q5 – How do you handle the uneven geometry of streambeds when measuring flow? – 09:03

  • Modern instrumentation utilizes ultrasound to accurately map the cross section of a stream and particulate to determine flow rate.
  • Prior to ultrasound, hand operated “beeper” devices utilizing wire filaments and miniature turbines were drawn at intervals across the bed to create a cross section. These devices are still in use for verification and validation of modern systems.

Q6 – Why do errors appear and how can we compensate for them? – 11:20

  • Most errors that occur are due to hardware errors in the field, which are corrected, or if necessary, omitted by the various procedures and redundancies during the certification process.
  • Estimates of a value between sensor points are sometimes computed and will have a margin of error. These, however, are clearly marked in meta data is being computed estimates and not certified collection.
  • The USGS has created many of the procedures used by other entities for data review and accuracy certification in house, including several published books and texts.

“Back in the day a filament might have stuck on a recorder or something like that, but then that’s part of why we check and review things.”

Q7 – What essential information does the data obscure or leave out? Who is most likely to be affected by those omissions? – 12:41

  • Network (sensor) density is a primary concern. Across the tri-state (KY/OH/IN) area, the USGS monitors 800+ sensors, but these are spread throughout an area of over 315,000 square Kilometers. More sensors would be an obvious improvement, but funds and labor are always at a premium.
  • Anthropogenic influence. Sensors were primarily distributed in rural areas, but the watersheds are increasingly encroached upon by human development. This can affect historical data to a degree as runoff trends are altered by human activity. Ex: Pavement or gravel vs. forested land.

“Over the years, the number of gauges has gone up, but are in a lot more urban areas.”

Q8 – What is the pre‐history of the data set? What led to its collection? – 15:05

  • Prior to USGS, any water availability measurements came through a disparate network of samples, estimations, and observation.
  • USGS came about to create a unified network of collection hardware and procedures to gauge the available water resources and assist other agencies (i.e. the then Weather Bureau). The first USGS gauge was established on the Rio Grande in New Mexico as a proving unit. This site became a testing ground for various technologies and procedures to establish collection methods used to the present day.

“The way we do it has evolved, but the core of it is still that (NM testing Camp) at heart.”

Q9 – How is it used by the organization that created it? – 17:15

  • The data is used as a benchmark for underlying systems (primarily climate). Long term, continuous data enables finding trends (if any) over periods beyond typical human sphere of awareness.
  • The data is valuable when looking for specific event probabilities. Cited examples are flood statistics, flood probabilities, and habitat assessments.

“High resolution data allows to, really, look at an accurate picture of what’s happening because we’ve got enough data to pick up those small tends, and it’s long enough to pick up the underlying signal too.”

Q10 – How was similar data collected in the past? – 19:22

  • Primary utilizing a Stevens Recorder (continuous paper feed device attached to a weighted float that moved the writing needle as water raised and fell accordingly). Local staff (paid a then generous 1USD a day) maintained the devices (changing paper, fixing jams, etc.). Runners periodically collected the paper tapes for transport to National Archives.
  • Offices remained regional until 1913, then dissolved and moved to Washington DC. Complaints from stakeholders eventually resulted in re-establishment of regional office stations in 1938.
  • In 1972, utilizing satellite transmission at sensor emplacements enabled real-time collection and eliminated the necessity of paper runners.
  • As of 2024, an effort is underway to replace satellite transmission with cell networks where possible to further reduce latency.

Q11 – How are such data collected differently in other places? – 21:41

  • For the most part, data collections are standardized. USGS works closely with its international counterparts, most of whom utilize USGS methods.
  • All USGS technology, methods, and codes are made open source for use by agencies in and outside of the US.
  • USGS technology also extends to ostensibly unrelated technology. Examples include high-fidelity audio equipment.
  • USGS does not participate in regulation activities, allowing it to work with other agencies and stake holders who may have competing interests.

“There’s a big push now, where we have a metadata wizard, we put out to help people write you know, good, consistent, accurate metadata.”

“That’s the thing, we are not regulatory. We are scientists and technicians…”

Q12 – What are some of the logistical procedures with data collection (i.e., maintenance of gauges)? – 27:50

  • The Regional offices operate smaller offices and a staff of technicians to perform maintenance and field studies as needed. Currently the Louisville office houses 70 technicians for the tristate area and a fleet of 10 staffed and numerous unmanned watercrafts.
  • Procedures are carefully employed to make maximum use of staff availability.

“We’ve just got a good process to do it. Process is everything.”

Q13 – What type of networking is used to collect data from stream gauges? – 32:51

  • The complexity of a site depends on the needs. Some are quite complex, with networks of multiple sensors over a local network with fiber optic link to central mainframes. Most sites are self-maintaining sensors with a satellite link.
  • Currently moving sites to cell networks.
  • Some units in high concentration urban areas use mesh networks when it is possible for cost savings.

“It really just depends on the needs of the site and how we can make it the most cost effective.”

Visualizing Data Life Cycle

              As previously mentioned, a vitally important facet of understanding the USGS process is in being a primary source, the USGS does not collect data from external entities. Rather, it generates data by gathering measurements from its own sensors and placements. As Mr. Cinotto repeatedly emphasized (00:54), the USGS mission is to provide defensible data to stakeholders, often with disparate and even competing interests. To successfully fulfill this mission, the USGS is not a stakeholder and does not consume its own data. It short, it offers no policy recommendations and no critical analysis other than strict conversion of raw data to readable units and charts.

            Instead, the USGS process revolves around ensuring accuracy of the data collected. Arrays of automated sensors take measurements relay raw data to regional offices via satellite or cellular networks. These measurements are augmented and verified by manual collection efforts utilizing firmly established and reliable technologies dating back to the late 1800’s or earlier. Captured data is made immediately available in real time for use by stakeholders, clearly marked as “provisional data.” Post collection, all data then goes through a process of review utilizing an array of heuristics, comparing historical trends, known limits, and manual samples. Any inaccuracies are immediately reviewed for the offending source. The most common issue would be a temporary sensor failure, which might produce a “zero” result. If this data can be replaced with an accurate manual measurement, or an average from nearby sensors, it is marked with the type of correction applied and remitted back through the certification process. Otherwise, the data is discarded. In either case, corrective action is immediately applied at the point of collection to avoid repeat errors.

            Once data is verified against all review procedures, it is then certified, and placed into permanent storage, making it publicly available for consumption by stakeholders.  

The following flowchart provides a step by step of the USGS process from sensor to public display.

  1. Sensors take measurements, passed on to regional systems.
  2. Raw data is converted to human readable metrics.
  3. Collected data is made available to public in real time, as clearly marked “provisional data.”
  4. Data certification process begins. See previous summary for details.
  5. Known good data is marked certified, remitted to storage, and made available for public consumption.
  6. Errors are reviewed for correction or discard. Corrections are provisional and passed back through certification process.

Comparative Visualizations

              Runoff data is an interesting combination of high sample volume (water years) and wildly differing scales for each of its comparative data points (amount, ranking, and percentile). For example, the scale of rankings equals 0 to the number of years recorded (124 thus far), while average runoff amounts are measured in inches, with a range of 0 to 2.5. Percentiles are measured in whole numbers of 0 – 100. As a result, the data resists charts fully inclusive of all points while still providing meaningful information to the user.

              To help ameliorate this, I removed the ranking and percentile, leaving only amounts. Since the end goal is to convey the visible patterns (if any) in run off totals, the singular data point of average yearly runoff is sufficient.

Charts 

              After noting the surprising lack of trend in either runoff extremities or reduction in recent years I elected to create three charts, as seen below. All three disprove the anecdotal hypothesis of increased weather extremities or reduced runoff over the past 100 years.

Scatter

The scatter chart is arguably least effective in spotting trends (or lack thereof) but does clearly indicate a rhythmic pattern in the runoff spread.

Area

              I consider the area chart most effective for this data analysis. I had planned to add a trend line, but a cursory glance shows there is no need. Over the last 124 years the state has maintained a consistent runoff pattern, with spikes and troughs almost rhythmic in nature.

Radar

            I added a radar chart due to personal preference. It is a favorite of mine and I simply wished to see how the runoff data would appear. While the lack of trend is again visible, it is not as effective as a line or area chart. Moreover, the high sample number renders the chart overly busy and unprofessional looking.

References

Cave Run. (2023, December). Daniel Boone National Forest – Cave Run Lake. Forest Service National Website. https://www.fs.usda.gov/recarea/dbnf/recarea/?recid=39320

Drought. (2023, November 1). Climate Change Indicators: Drought. EPA. https://www.epa.gov/climate-indicators/climate-change-indicators-drought

H.R.2617 – 117th Congress (2021-2022): Consolidated Appropriations Act, 2023. (2022, December 29). https://www.congress.gov/bill/117th-congress/house-bill/2617

NRFA. (2024, January). National River Flow Archive. https://nrfa.ceh.ac.uk/

Nielsen, J. P., & Norris, J. M. (2007). From the river to you—USGS real-time streamflow information: U.S. Geological Survey Fact Sheet 2007–3043. Retrieved from http://pubs.usgs.gov/fs/2007/3043/

United States Geological Survey. (2024). USGS Current Conditions for USGS 03254520 Licking River at Hwy 536 near Alexandria, KY. Retrieved from https://waterdata.usgs.gov/monitoring-location/03254520/#parameterCode=00065&period=P7D&showMedian=false

Van der Leeden, F., Troise, F. L., & Todd, D. K. (1990). The Water Encyclopedia (Second ed.). Chelsea, Michigan: Lewis Publishers.

Confirmation Bias and Digital Divide

The following is a mock research proposal completed at the behest of ICT600-201 at the University of Kentucky over a two day period. It should not be construed as a ready proposal. All rights reserved.

Is political confirmation bias contributing to the digital divide?

Abstract

The convergence of social media and digital technology has amplified the voices of historically marginalized communities – including inner-city minorities, LGBTQ+ individuals, rural Appalachian residents, small-scale farmers, and ethnic minorities. These tools have, in theory, democratized access to civic participation and information-sharing once reserved for more privileged groups. However, as digital connectivity becomes more widespread, a persistent – and increasingly complex – digital divide endures. While physical access to technology is improving, political and cultural silos are deepening (Nadeem, 2022). This trend suggests that the digital divide is no longer solely about infrastructure or technical proficiency, but also includes attitudinal barriers rooted in cognitive bias. These biases, often shaped by polarized political identities, may inhibit individuals’ willingness or ability to engage with digital tools and information, reinforcing cycles of exclusion.

Redefining the Digital Divide

The digital divide is traditionally defined as a lack of broadband access to internet resources (Coleman & Atkinson, 2011). Yet recent trends in technology usage suggest that this definition is increasingly incomplete. Simply running a wire into a home or placing a smartphone in someone’s hand does not automatically confer the skills or awareness needed to engage meaningfully with digital content. This deeper layer of inequality — often referred to as the cognitive divide — encompasses gaps in digital literacy, critical thinking, and information processing. In fact, this cognitive component is frequently cited as a more stubborn and complex barrier than physical access alone (Fonseca, 2010).

Increasing Division

Political, moral, and cultural divisions have long been part of human society. Even within the relatively brief history of the United States, such divisions have often turned violent – most infamously during the Civil War, which left a lasting scar rooted in deep cultural and ideological bias. Closer to home, Kentucky offers its own history of internecine conflict. The Hatfield and McCoy feud, now more folklore than fact, stands as a symbol of how personal and political disputes can spiral into prolonged hostility. This author’s own hometown of Morehead saw the “Rowan County War” – a near open rebellion including government seizure, and multiple state militia deployments – all fueled by political strife and escalating personal animosity.

These historical episodes share a common thread: a breakdown in dialogue driven by cognitive bias – the mental shortcuts and judgments we form based on deeply held beliefs. While today’s divisions may not lead to literal shootouts, they are arguably more entrenched. According to a 2022 Pew Research Center study (Nadeem, 2022), political animosity in the U.S. has increased dramatically over the past two decades, with citizens not only disagreeing on policy, but actively disliking and distrusting those from opposing political parties. This growing polarization, mirrored in democracies worldwide, aligns closely with the rise of mobile internet and social media – technologies that can both connect and divide. The correlation raises an urgent question: is political cognitive bias now a barrier not just to civil discourse, but to digital inclusion itself?

Impact

The digital divide imposes a social and economic cost not only on those directly affected, but on society as a whole. For instance, as industries increasingly prioritize efficiency and automation, tasks as basic as applying for a job are often confined to online platforms. Individuals who attempt to apply in person are commonly redirected to kiosks or websites – effectively excluding those without the necessary digital skills or access. This not only marginalizes already vulnerable populations, but also reduces the available labor pool, hindering workforce development and deepening socioeconomic inequality (Steele, 2018).

These realities make it clear: the digital divide is not simply a matter of technology access. Cognitive and attitudinal barriers – such as lack of confidence, digital literacy, or trust in online systems – may play just as significant a role and are often far harder to address. A deeper understanding of these barriers is essential if we hope to develop targeted, effective strategies for bridging the gap and fostering true digital inclusion.

Objectives

The primary goal of this research is to determine whether a relationship exists between cognitive bias and attitudinal barriers that contribute to the digital divide. Specifically, it seeks to understand how political identity and associated biases may influence an individual’s willingness or ability to engage with digital tools and platforms.

By identifying this relationship, the study aims to inform the development of targeted educational programs that address these non-technical barriers. Such programs could help increase digital participation across underserved communities by improving confidence, trust, and digital literacy.

The findings may be valuable to educational coordinators, non-profit organizations, and community leaders working to bridge the digital divide. Additionally, industry stakeholders seeking to access untapped labor markets may benefit from insights into how attitudinal barriers affect workforce readiness. Finally, the research may lay a foundation for future studies focused on identifying and mitigating the granular causes of political or cultural resistance to technology adoption.

Literature Review

The digital divide is widely acknowledged as a persistent societal issue, documented across both anecdotal reports and peer-reviewed literature. However, despite broad agreement on its importance, scholars differ significantly on its root causes and even on how to define it. Three primary conceptualizations of the digital divide are commonly cited:

  1. Access to Hardware and Connectivity:
    Frederick (2019) defines the digital divide as a basic gap in access to computer hardware and internet connectivity. This approach treats the issue as a logistical challenge – one that can be resolved through device distribution and network infrastructure. While straightforward, this definition fails to consider how effectively users engage with the technology once they have it. It also ignores the long-term sustainability of hardware deployment and ongoing support needs.
  2. Broadband Quality and Availability:
    Coleman and Atkinson (2011) expand the definition to emphasize access to broadband internet. This framing introduces the idea of connection quality, highlighting that intermittent or slow connections can leave communities functionally unconnected despite appearing “online.” However, the lack of a universally accepted definition of “broadband” and the continued focus on infrastructure over engagement still limit this approach.
  3. Cognitive and Functional Digital Literacy:
    Fonseca (2010) proposes a more nuanced view, suggesting that the digital divide also includes the inability to understand, learn, express, and create using technology. Rather than centering on devices or bandwidth, Fonseca frames the divide as a human development challenge – where educational access and digital fluency determine whether technology can be used meaningfully. This “cognitive divide” often emerges from socioeconomic inequalities that perpetuate themselves over time. For example, Fonseca highlights Costa Rica’s national initiative to blend digital and creative skills training, which has since positioned the country as a regional tech leader.

Building on this perspective, Partridge (2007) explores attitudinal barriers – psychological and emotional factors such as self-confidence and perceived relevance – which can deter individuals from engaging with digital tools. Importantly, Partridge finds that these barriers are often tied to age rather than socioeconomic status. Older adults may avoid technology not because of a lack of access, but due to internal doubts about their ability to learn or adapt.

Thrane et al. (2008) further complicate the picture by showing that technology resistance is not exclusive to older generations. They argue that even younger individuals can resist new digital tools if they fall outside the scope of their generational norms. This challenges the common assumption that digital fluency naturally increases over time and across younger cohorts.

Despite these insights, few studies have explored how cognitive bias, particularly political bias, may shape or reinforce attitudinal barriers to technology adoption. Cognitive bias – the tendency to process information through personal and ideological filters (Gillis & Bernstein, 2022) – could play a crucial role in digital exclusion. This research seeks to address that gap by examining whether politically-driven biases correlate with resistance to digital engagement, especially in communities already affected by limited access.

Methodology

This study will utilize a Likert-scale survey to examine potential relationships between political identity, cognitive bias, and digital engagement – supplemented by a series of semi-structured follow-up interviews to provide deeper qualitative insight.

Survey Design

The Likert survey will collect data in the following key areas:

  • Political self-identification and degree of political alignment or passion
  • Preferred sources of information (e.g., news outlets, social media)
  • Attitudes toward opposing political perspectives and individuals
  • Trust in alternative or unfamiliar informational sources
  • Self-reported quality and reliability of online access
  • Perceived importance of internet access in daily life
  • Perceived importance of technology in educational contexts

A sample survey is provided in the Supplemental section below.

The survey will be administered in both digitally connected regions and regions affected by digital exclusion, enabling comparative analysis of cognitive and attitudinal profiles. Special attention will be paid to ensure geographic and demographic diversity in the respondent pool.

To overcome the anticipated challenges of access and engagement in digitally disconnected areas, manned kiosk stations will be deployed in high-traffic community spaces such as grocery stores, courthouse lobbies, and school drop-off zones to support in-person participation.

Survey Data Analysis

Collected survey data will be analyzed using the Proportional Odds Model – an ordinal regression technique suitable for interpreting ordered categorical responses. This model will test whether variables such as political alignment intensity or information source trust are predictive of attitudes toward digital tools, platforms, and usage patterns.

Measurable concentrations of politically aligned cognitive bias in areas with limited connectivity – compared to areas with stable access and lower bias – may indicate that attitudinal barriers are contributing to the digital divide.

Follow-Up Interviews

To complement survey findings, a series of semi-structured interviews will be conducted to capture the lived experiences, perspectives, and emotional narratives underlying participants’ digital behaviors and biases. These interviews will aim to reveal how political identity and cognitive bias influence digital inclusion, as expressed in participants’ own language.

Participant Selection

Interview participants will be randomly selected from the survey respondent pool using stratified sampling to ensure representation across the following demographic cohorts:

  • Geographic location (urban, suburban, rural)
  • Political self-identification (conservative, liberal, independent, apolitical)
  • Age group (e.g., 18–29, 30–49, 50–64, 65+)
  • Level of digital access (stable broadband, intermittent or mobile-only, no home access)
  • Education level

This approach ensures a diverse, representative subset while allowing for the emergence of cohort-specific themes and cultural patterns.

Interview Format and Delivery

Each interview will last approximately 30 to 45 minutes and follow a semi-structured protocol – ensuring consistency in core questions while allowing flexibility to explore emergent topics.

Interviews will be conducted via:

  • In-person sessions at libraries, community centers, or mobile kiosk stations
  • Phone or video conferencing (where feasible)
  • Partnerships with trusted local organizations to support outreach and moderation in low-trust or underserved areas

With participant consent, all interviews will be audio-recorded and transcribed for analysis. An interview script sample is included in the Supplemental section.

Interview Data Analysis

Interview transcripts will undergo thematic coding, blending:

  • Deductive codes informed by survey constructs (e.g., trust, digital fluency, political bias)
  • Inductive codes developed organically during transcript review

The resulting insights will help interpret and contextualize statistical patterns observed in the survey data. Moreover, they will highlight nuanced barriers – such as distrust in digital systems, identity-linked disengagement, or generational resistance – that may inform targeted educational strategies and culturally responsive digital inclusion efforts.

Limitations

Achieving an even and representative distribution of survey responses poses a significant challenge, particularly given the differing behaviors and access levels between digitally connected and disconnected populations. Simply collecting equal numbers of surveys from both groups may not be sufficient to account for structural and behavioral biases. A statistical weighting formula may be required to adjust for such disparities and reduce the risk of skewed results.

Moreover, the multifaceted nature of the digital divide introduces the potential for misattribution. It would be both methodologically flawed and ethically inappropriate to assume that individuals who exhibit strong political views and reside in disconnected areas necessarily suffer from cognitive or attitudinal barriers. The existence of cognitive bias alone does not imply resistance to digital engagement, nor does it confirm that political alignment is the root cause of digital exclusion.

Many contributing factors – such as infrastructure limitations, economic hardship, or geographic isolation – lie beyond the control of individuals and may exert a more direct influence on digital access. The identification of attitudinal barriers, if present, should therefore be seen not as definitive evidence of politically driven exclusion, but as an indicator warranting further investigation. This study aims to identify correlations that could inform deeper, more targeted research into the psychological and sociopolitical dimensions of the digital divide.

References

Coleman, P. D., & Atkinson, J. K. (2011). The digital divide in Kentucky: Is rural online learning sustainable? Retrieved December 7, 2022, from http://www.jsedimensions.org/wordpress/wp-content/uploads/2011/03/Atkinson2011.pdf

Fonseca, C. (2010). The Digital Divide and the Cognitive Divide: Reflections on the Challenge of Human Development in the Digital Age. Retrieved December 5, 2022, from https://itidjournal.org/index.php/itid/article/download/618/618-1657-2-PB.pdf

Frederick, D. E. (2019, September 3). The Fourth Industrial Revolution and the digital divide. Library Hi Tech News. Retrieved December 9, 2022, from https://www.emerald.com/insight/content/doi/10.1108/LHTN-07-2019-0048/full/html

Gillis, A. S., & Bernstein, C. (2022, June 22). What is cognitive bias? Enterprise AI. Retrieved December 5, 2022, from https://www.techtarget.com/searchenterpriseai/definition/cognitive-bias

Nadeem, R. (2022, November 17). As partisan hostility grows, signs of frustration with the two-Party system. Pew Research Center – U.S. Politics & Policy. Retrieved December 7, 2022, from https://www.pewresearch.org/politics/2022/08/09/as-partisan-hostility-grows-signs-of-frustration-with-the-two-party-system/

Partridge, H. (2007). Redefining the digital divide: Attitudes do matter! Retrieved December 5, 2022, from
https://asistdl.onlinelibrary.wiley.com/doi/10.1002/meet.1450440251 Steele, C. (2018, December 17). The impacts of digital divide. Digital Divide Council. Retrieved December 8, 2022, from http://www.digitaldividecouncil.com/the-impacts-of-digital-divide/

Thrane, L. E., Shelley, M. C., Shulman, S. W., Beisser, S. R., & Larson, T. B. (2008). E-political empowerment – taylor & francis. Taylor & Francis Online. Retrieved December 5, 2022, from https://www.tandfonline.com/doi/abs/10.1300/J399v01n04_03

Supplemental

Survey Sample

Political Identity and Passion

  1. I consider myself strongly aligned with a particular political party or ideology.
  2. My political beliefs are an important part of my personal identity.
  3. I frequently discuss politics with friends, family, or coworkers.
  4. I feel emotionally affected by political events or decisions.
  5. People with opposing political views often seem misinformed or misguided.

Preferred Information Sources

  1. I primarily get my news from sources that reflect my personal views.
  2. I often cross-check information from sources with opposing viewpoints.
  3. I trust information from major national news networks.
  4. I rely heavily on social media to stay informed.
  5. I avoid news sources that frequently feature views I disagree with.

Attitudes Toward Opposing Views

  1. I find it difficult to have respectful conversations with people who have opposing political views.
  2. I believe people with different political beliefs can still have valid perspectives.
  3. I often feel frustrated or angry when reading political opinions that differ from mine.
  4. I would feel uncomfortable attending a community event where the majority of attendees support a different political party than I do.

Trust in Unfamiliar or Unused Sources

  1. I am skeptical of new or unfamiliar news sources, even if others recommend them.
  2. I believe that some information online is intentionally misleading or manipulative.
  3. I tend to trust content only if it aligns with what I already believe.
  4. I avoid websites or apps I don’t recognize or haven’t used before.

Digital Access and Literacy (Self-Reported)

  1. I have regular and reliable access to high-speed internet.
  2. I feel confident using digital tools like email, online forms, or mobile apps.
  3. I often struggle to keep up with new technology.
  4. I am comfortable learning new digital tools when needed.
  5. I feel left out when services or activities move entirely online.

Perceived Importance of Internet and Tech

  1. Access to the internet is essential for full participation in modern society.
  2. I believe internet access is a human right.
  3. Technology is important for equal access to education.
  4. I would attend training or workshops to improve my digital skills, if available.
  5. I feel that technology can help bridge divides in society, not widen them.

Optional Demographics

  • Age range
  • Education level
  • Annual household income (ranges)
  • ZIP code or county of residence
  • Primary language spoken at home
  • Employment status

Interview Sample

Key Interview Topics

  • “What kinds of support or resources would help you feel more confident using digital tools?”

Personal technology use

  • “How do you use the internet in your daily life?”
  • “Are there tools or platforms you avoid, and why?”

Political identity and trust

  • “Do you think your political beliefs influence how you engage with digital platforms?”
  • “Are there online spaces or news outlets you avoid because of how they represent political issues?”

Perceptions of digital inclusion

  • “What would make it easier or more comfortable for you to use technology?”
  • “Do you trust information you find online? What makes you decide whether to believe it?”

Barriers to engagement

  • “Have you ever avoided a service, program, or opportunity because it was only available online?”

Slacktivism – Analyzing Pseudo Participation of Active Causes Through Social Media

Slacktivism is the act of engaging in visible displays of support for a cause at little to no cost, while lacking any genuine intent to contribute to tangible change (Kristofferson, White, & Peloza, 2013). Although social media empowers individuals to launch grassroots campaigns, organize charitable efforts, and rapidly generate support for various causes, it also facilitates superficial participation with minimal real-world impact. Common examples include wearing bracelets or pins, signing online petitions, using hashtags, and the ubiquitous Facebook like (Kristofferson et al., 2013).

Image tagged in worf and picard - Imgflip

Importance

Slacktivism, hashtag activism, or this author’s preferred term “pseudo participation” is an important area of research due to the vast amount of resources involved in modern social activism. Political campaigns, disaster relief, charitable donations, and other causes are all shaped by the rise of social media. Because social platforms are easily accessible and – unlike traditional mass media – enable two-way communication, they have the potential to reduce the influence gap between large institutions and individual users. For example, social media allows almost anyone to participate directly in political campaigns or join action groups, increasing their sense of agency and investment in society (Kwak et al., 2018).

However, that same ease of access can create a false sense of meaningful participation – one unconnected to risk, effort, or real-world effect (Foster et al., 2019). More concerning, as social media begins to mirror traditional media in its trickle-down communication structure (Chou et al., 2020), it is increasingly used by established institutions as well. In such cases, token acts of support may reinforce self-delusion and, paradoxically, leave individuals more disengaged than if they had not participated at all.

Main Takeaways: Analyzing Pseudo Participation

Social media, though now ubiquitous, is still a relatively new element of society. The debate between active and passive participation, however, is not. In 1970, faced with the rise of television culture, Gil Scott-Heron famously declared, “The Revolution will not be televised,” expressing his belief that only real-world action could drive meaningful change (Glenn, 2015). Nearly half a century later, Andrew Sullivan responded to the 2009 Iran uprising by proclaiming, “The Revolution will be Twittered,” highlighting the growing role of digital platforms in social movements (Glenn, 2015).

The truth lies somewhere in between. While tweets and Facebook posts can easily be dismissed as white noise, a protest of 50,000 people – organized through those very channels – is much harder to ignore. Social media blurs the line between passive expression and real mobilization.

This dynamic applies to non-political causes as well. When Hurricane Harvey struck near Houston in 2017, causing over $125 billion in damages and displacing thousands (New York Times, 2017), social media played a key role in mobilizing relief. Platforms like Facebook helped organizations such as Samaritan’s Purse recruit over 10,000 volunteers (this author included) to assist in cleanup and recovery efforts (Samaritan’s Purse, 2017). Although no data exists on passive responses such as likes or hashtags – as Twitter and Facebook do not release participation statistics – the anecdotal evidence suggests that social media remains a net positive for activism.

Research indicates that the visibility of one’s actions predicts the likelihood of deeper involvement. Observable token efforts – like hashtags or profile filters – satisfy the need for social recognition and may reduce the drive to do more. In contrast, less visible forms of participation often activate a person’s sense of internal value, increasing the chance of further involvement (Kristofferson et al., 2013).

Charitable giving via social media also reflects this tension. E-pledges, while symbolic, carry no obligation if donors fail to follow through. Some people also distrust the validity of these pledges (Chou et al., 2020). Still, because the cost of solicitation is so low, even low conversion rates can make e-pledging an attractive fundraising tool.

Not all scholars agree that passive participation is inherently shallow. Some suggest it plays a meaningful role in what they call “information activism” – the collective awareness-building that amplifies causes over time. While passive participants may reject riskier offline activism as unnecessary or ineffective (Kwak et al., 2018), their digital actions may still have real-world consequences. Since collective action is often defined by intent, even minimal contributions that support a cause can be considered active participation (Foster et al., 2019). In theory, spreading awareness alone can create tangible social change – meaning token efforts may, over time, become part of a larger, effective movement.

Strengths and Limitations of the Research

A major concern in studying slacktivism through social media is the limited availability of usable data. Most major platforms treat engagement metrics and participation details as proprietary trade secrets. As a result, researchers must construct empirical models that attempt to simulate real-world behavior – a task complicated by the sheer scale and variability of online interactions.

One attempt to assess downstream participation following a token effort was conducted by Chou et al. (2020). In this study, 93 students were recruited under the guise of participating in a game to minimize behavior shaped by expectations. Each participant was randomly assigned one of three methods to “sign” a petition:

  • Clicking a “like” button
  • Signing with initials
  • Signing with a full name

Participants were then asked to offer suggestions for improving the study. While all completed the initial task, only 47% voluntarily submitted suggestions. This controlled environment effectively measured the effort-to-outcome ratio but did not account for social observability or the differing motivations tied to visible versus private participation – key variables in real-world slacktivism.

In contrast, Kristofferson et al. (2013) conducted a real-world field study at the University of British Columbia. Leading up to Remembrance Day, researchers positioned themselves in a hallway near a student cafeteria and approached participants with one of three options:

  • Public token: A poppy pin for veterans, placed visibly on the student’s clothing
  • Private token: The same pin, provided in a sealed envelope
  • No token: No pin offered

At the end of the hallway, participants were then asked to make anonymous donations. The results showed that students who received the private token donated an average of $0.85, while those with a public token gave only $0.35. This finding supports the idea that personal, internal motivation can be stronger than visible, performative gestures. Still, the uncontrolled environment of a university hallway means the findings should be interpreted with caution.

One common limitation across these studies is the use of student participants. While researchers took steps to ensure racial and gender diversity, the convenience sample heavily favored individuals between the ages of 20 and 30. This narrow demographic introduces bias and may not reflect the broader population’s behavior, especially across different age groups or cultural contexts.

Directions for Future Research

Existing studies tend to focus on isolated aspects of slacktivism, such as effort versus reward, or visible recognition versus personal value. While these are important building blocks, future research should aim to integrate these findings into more comprehensive behavioral models. This would provide a fuller understanding of how digital and physical activism interact over time.

One of the greatest challenges remains the limited access to social media data. This barrier could be addressed through the creation of experimental activist communities or by collaborating with existing groups willing to share participation metrics. With access to real engagement data, researchers could more effectively compare digital slacktivism with real-world follow-through.

Demographic diversity is another area needing improvement. Most existing studies rely heavily on university students – a group that represents only a narrow age and cultural band. Older individuals, as well as much younger users, may engage with social and political causes in distinctly different ways. Capturing those differences is critical for any model that aims to reflect the true spectrum of participatory behavior.

Conclusion

Casual observation may suggest that slacktivism is undermining traditional activism, but research reveals a far more complex relationship. Like most human behaviors, participation exists on a spectrum – and social media simply provides a new venue for both active and passive engagement. It did not create activism or slacktivism, nor does it define them.

More research is needed to fully understand whether digital participation displaces meaningful action or enhances it. What is clear, however, is that social media has permanently altered how causes gain visibility, and how people choose to engage with them – for better or worse.

References

Chou, E. Y., Hsu, D. Y., & Hernon, E. (2020). From slacktivism to activism: Improving the commitment power of e-pledges for prosocial causes. Plos One, 15(4). doi: 10.1371/journal.pone.0231314

Glenn, C. L. (2015). Activism or “Slacktivism?”: Digital Media and Organizing for Social Change. Communication Teacher, 29(2), 81–85. doi: 10.1080/17404622.2014.1003310

Kristofferson, K., White, K., & Peloza, J. (2013). The Nature of Slacktivism: How the Social Observability of an Initial Act of Token Support Affects Subsequent Prosocial Action. Journal of Consumer Research, 40(6), 1149–1166. doi: 10.1086/674137

Kwak, N., Lane, D. S., Weeks, B. E., Kim, D. H., Lee, S. S., & Bachleda, S. (2018). Perceptions of Social Media for Politics: Testing the Slacktivism Hypothesis. Human Communication Research, 44(2), 197–221. doi: 10.1093/hcr/hqx008

Foster, M. D., Hennessey, E., Blankenship, B. T., & Stewart, A. (2019). Can “slacktivism”

work? Perceived power differences moderate the relationship between social media

activism and collective action intentions through positive affect. Cyberpsychology:

Journal of Psychosocial Research on Cyberspace, 13
(4), article 6.

https://doi.org/10.5817/CP2019-4-6

Samaritan’s Purse. (2017). Help Hurricane Harvey Victims in Texas. Retrieved May 24, 2020, from https://www.samaritanspurse.org/disaster/hurricane-harvey/

The New York Times. (2017, August 26). Harvey, Now a Tropical Storm, Carves a Path of Destruction Through Texas. Retrieved from https://www.nytimes.com/2017/08/26/us/hurricane-harvey-texas.html

Journal Article Analysis – Melhart

Towards a Comprehensive Model of Mediating Frustration in Videogames

Topical Relations

Answering how any topic relates to my professional career may feel a bit slippery at times, though it’s rarely difficult. I work as a software developer and serve as the Technology Officer at the Environmental Health and Safety (EHS) Division of the University of Kentucky – a position that comes with a whole rack of hats. Even if you strip that down to the more familiar title of “programmer,” you’ll find it still maintains a curious relationship with nearly every other field of study.

Let’s grab something entirely at random – HVAC (Heating, Ventilation, and Air Conditioning). What do compression ratios, British Thermal Units, and humidity have to do with keyboard jockeys? Other than ensuring a comfy office, that is. Easy answer – heat. Tech enthusiasts may not like to admit it, but underneath the polished exteriors, the semiconductor chips that drive every electronic device are just glorified abacuses. At the core, we’re still dealing with binary zeroes and ones – each represented by a microscopic transistor, itself just a tiny electric gate. Control one and you’ve got a light switch. Stack a few billion, and suddenly you’ve got the horsepower to model climate systems, analyze chemical compounds, or run whatever device you’re using to read this. Of course, with great computing power comes a whole lot of waste heat. Touch a CPU mid-operation, and the blister on your fingertip will make its own argument. Without robust, reliable, and extremely well-engineered cooling systems, everything from mobile phones to courthouse networks would grind to a steaming, acrid halt.

That might sound like a tangent, but it illustrates the point – interconnectedness isn’t hard to find. At a glance, the article in question relates to my work because it touches on human interface design, a core component of what I do. Look a little deeper, and the real answer becomes even simpler: when you work with systems and synergy in mind, every topic connects.

Two primary questions stood at the center of the article’s research phase:

  • How do players react to frustrating situations arising during gameplay?
  • How do players keep themselves motivated during frustrating scenarios?

The broader investigation focused on how players manage to persist through games when those games become, for lack of a better word, un-fun. Or put differently – how does an activity that consumes time and productivity, offering little tangible reward beyond the joy of playing, manage to retain a player’s attention during its most aggravating moments?

To explore those questions, researchers conducted a pilot study designed to test a central hypothesis: that players maintain motivation through a desire to restore the effort-reward balance of gameplay.

It was proposed that players carry a kind of lingering internal focus – a vague but persistent drive that survives the frustrating moments. Because video game play is understood to be intrinsically motivated (Lafrenière et al., 2012, p. 827), it was further suggested that persistence stems from a contextual intrinsic motivation – an urge to return to the flow state where effort and reward align.

The core research followed a peer-reviewed model, relying on a focus group of three and a series of semi-formal interviews with nine male test subjects – all of whom self-identified as gamers.

A clear challenge with this approach is the heavy dependence on individual experience and personal interpretation. This type of data is soft – or more precisely, qualitative. Whether reliable or not, qualitative data often resists easy analysis.

To address the inherently subjective nature of the results, the post-interview data processing leaned on the Template Analysis method. According to Dr. Melhart, this model is specifically designed to uncover patterns within mixed qualitative and semi-qualitative datasets pulled from interviews.

The method uses any qualitative or quasi-qualitative data – usually interview transcripts (Brooks & King, 2014, p. 4) – to construct a continuously evolving template of codes (King, 2012, p. 426) that are later interpreted by the researcher (King, 2012, p. 446; Brooks & King, 2014, p. 8).

It’s All CRAAP

Passing or failing a set of acronyms doesn’t automatically determine whether a piece of writing belongs in the press or the trashcan. Still, a basic review rubric gives us a reasonable framework for evaluating quality.

Currency: Barring any truly disruptive breakthroughs in human psychology or interactive entertainment, the study’s subject matter and approach remain current by contemporary standards and references.

Relevance: From a personal standpoint, the study holds little direct interest. However, as mentioned earlier, all studies are relevant to all people once you consider how human knowledge interconnects. For those working in psychology or developing applications that engage directly with end users, this might not just be relevant – it could be essential reading.

Authority: The article is published on a site dedicated to gaming studies. It’s somewhat difficult to gauge its authority against others, as the study itself is breaking new ground. In effect, the research is helping to define its own scholarly space – and in doing so, it builds a kind of self-sustaining authority.

Accuracy: The language is professional and appears unbiased. That said, the heavy reliance on group-oriented qualitative research raises a caution flag – the risk of informational bias is present and worth noting.

Purpose: The stated goal is to open a new line of inquiry into games and player interaction. That may sound trivial on the surface, but it carries significant implications for anyone working in human-facing digital systems.

Like, Literary Reviewing

An extensive background summary and conceptual framework are both present and accounted for. Dr. Melhart structures his summary into clearly defined sections – offering a basic introduction, outlining the study’s purpose, detailing the methodology, discussing relevant theories, and defining key terms. Any flaws found in this article won’t stem from missing components. Structurally speaking, the foundation is solid.

Call Me Biased – Bigger is Better

Put bluntly, no ethical violations appear in the research. Dr. Melhart maintains a strong sense of neutrality – any sign of researcher bias is either absent or subtle enough to escape notice. That said, the study carries two serious flaws.

The first issue is scope. Consider the sample sources:

  • A three-member focus group
  • Nine male players interviewed

Altogether, the study hinges on just twelve participants. For the subject matter, this is an unacceptably small sample size. Worse still, it lacks any real diversity. All the subjects are male – and while it’s fair to say the gaming demographic often skews male, completely excluding female players injects immediate bias into the dataset.

Participant selection also relied on a loose combination of self-identification and peer suggestion. The first participant was chosen based on the criterion of frequently playing frustratingly hard games. From there, subjects were asked to nominate others who routinely played games considered hard or played on hard difficulty.

The study used a combination of selective and snowball sampling to try and offset selection bias. Even so, the small sample size and narrow demographic window introduce a significant weakness in the data – enough to undermine broader applicability.ess in representation. Enough to consider the entire data set poisoned.

Know Your Role

Dr. Melhart is quick to acknowledge the limitations of his research – most notably the small sample size and the potential for bias it introduces. He also addresses a more implicit limitation: this study is, by design, a prototype. Its results are not meant to stand alone, but to serve as a foundation for future, more comprehensive investigations.

The study presented through this paper has its limitations. The small sample size and inductive nature of the research make it akin to a prototype project. Nevertheless, the results of the study are promising and point towards new directions. Thus, the model is worth further development and research.
Melhart, D. (2018, April). Game Studies. Retrieved September 30, from http://gamestudies.org/1801/articles/david_melhart (p. 18)

Dr. Melhart also notes that his research does not attempt to differentiate between varying psychological profiles of player immersion – the so-called negentropic psychic states. He believes this omission has little bearing on the study’s overall data.

Overall, Dr. Melhart appears fully aware of both the strengths and shortcomings of his work. If there are limitations he failed to identify, they have escaped my notice as well.

Use It or Lose It

Choosing whether to apply or discount Dr. Melhart’s work in my own is an easy decision. This article is both unique and thorough. It blazes a trail for others to follow – doing so with full acknowledgment that there’s plenty of roughage left behind. I would confidently look to Dr. Melhart as a source of both data and inspiration.

Electric Boogaloo

For most of us, dealing with utilities or large corporations is straightforward, if a bit impersonal: pay your bills down to the last cent. If you don’t, the service gets cut, and the company will cheerfully chase you down for the balance – sometimes spending more than the bill itself to recover it.

This process makes sense. It simply isn’t feasible to manually handle every transaction or customer inquiry when a company serves thousands, or even millions. That’s where computers come in. Before automation, this was handled by rooms full of employees – highly trained, efficiently robotic humans who functioned as an analog computer. Either way, there’s no time for deliberation – only execution of policy.

The downside is obvious: when a human touch is needed, it can be frustratingly absent. We’ve all endured the endless menu loops, disinterested call center scripts, and bureaucratic black holes. Yet, we deal with it. Why? Because we expect to take responsibility for our own accounts, and we understand that if we don’t advocate for ourselves, no one else will.

Pompeii Estates of Bayside, New York, evidently sees things differently. In Pompeii Estates, Inc. v. Consolidated Edison Co. of N.Y., Inc., Pompeii sued the utility for “wrongful termination” of electrical service, claiming roughly $1,000 in property damage.
(Grimmelmann, J. (n.d.). Internet Law: Cases and Problems.)

Pompeii’s core argument was that notices of nonpayment were sent to the property itself, not to their business office – and as such, they were unaware of the issue. The court ruled in Pompeii’s favor, finding Consolidated Edison negligent for terminating service without proper notice.

I would argue the opposite – not only should Consolidated Edison have prevailed, but it may have had cause to counter-sue to recover costs and court fees.

Let’s consider a few facts:

  • Negligence is defined as a failure to exercise reasonable care – what a prudent person would do under similar circumstances.

  • The court ruled that by relying on computer-automated processes, Consolidated Edison failed to meet this standard.

While the computer is a useful instrument, it cannot serve as a shield to relieve Consolidated Edison of its obligation to exercise reasonable care when terminating service.”

That raises a question: Is it not also negligent to ignore your own bills? Is it not the very definition of carelessness to assume that, because a bill wasn’t received at your preferred location, no action is required? A prudent property owner should be aware of their own expenses. There’s no evidence that Pompeii made any effort to ensure those expenses were tracked or that notices – misdirected or not – were followed up on.

The court appeared to place all responsibility on the utility, stating that a human element was required to catch the failure. Yet in practical terms, any human – given the same information – would likely have made the same decision. If a bill goes unpaid for two months, and no response follows a termination notice, the only reasonable course of action is termination.

The court even stated:

Certainly, any reasonably prudent person, if in doubt, would contact Mr. Vebeliunas to ascertain the facts.”
This is especially so when the termination of service is in the middle of winter and the foreseeable consequences to the heating system and the water pipes are apparent. Where there is a foreseeability of damage to another that may occur from one’s acts, there arises a duty to use care.”

Let’s break that down. The ruling suggests that anyoneeven someone without ownership interest – should have foreseen the risk and acted. Yet somehow, the owner of the property is exempt from this expectation? If that’s the standard, we’re no longer dealing with a duty of care – we’re assigning blame based on who has the deeper pockets.

To be fair, perhaps we don’t have the whole picture. Maybe there were additional facts not captured in the case summary. Maybe the ruling was overturned on appeal. But based on the available documentation, this decision seems to reward the kind of passive negligence that, for the rest of us, would be laughed out of court.

What’s so smart about a House?

Smart houses are no longer approaching – they’ve already arrived. Voice activation has reached a critical user base, and many household devices are now “smart,” though not always in the way one expects when hearing the phrase smart home. Game consoles like Xbox and PlayStation, for example, double as media hubs, yet offer little in terms of real household value beyond games and streaming.

More impressive are the appliances that go beyond entertainment. Coffee makers now respond to voice commands through a central hub. Toasters remember your preferred shade of crispness. Convection ovens monitor not only heat and time, but also “smell” ingredients using advanced chemo-sensory tools. These innovations promise to liberate humans from mundane kitchen tasks – to free us up for whatever it is humans are still supposed to be doing.

Each of these devices shares a common weakness tied to connectivity: privacy. Concerns once centered on hackers stealing passwords. That threat still exists, but a deeper, more structural problem has emerged – one designed into the devices themselves. Data mining, targeted advertising, and bandwidth drain have become routine. Despite all this digital creepiness, the bigger issue might be more basic. Many of these devices simply fail to make life easier. At least, that’s the argument made by journalist Kashmir Hill:

“I’m going to warn you against a smart home because living in it is annoying as hell.” (Hill, 2018)

Full respect to Ms. Hill, though I couldn’t disagree more. I once shared her skepticism, and I voiced it loudly at the 2013 Future of Design Conference in Boston. During the opening forum, tech host Luria Petrucci described an emerging frontier – the Internet of Things. Several examples were offered, though one stood out: the smart ladle. As described, it would connect to a smartphone app and relay the temperature of your soup. To me, this was absurd – a needless gadget that wasted engineering time and research dollars. After all, a basic kitchen thermometer from the last century could do the job more reliably, more quickly, and without the help of Bluetooth. 

When the floor opened for questions, I raised my hand – confident, maybe even a little smug – glad to be the lone voice pushing back against tech for tech’s sake. Whiz-bang gadgets that solved problems nobody had struck me as a waste of time, money, and talent. Then Ms. Petrucci changed my mind with a single word: Market.

That simple word carries real weight. The market decides what survives and what fades into the junk drawer of history. Take a moment to consider:

  1. New technologies almost always come with a high price tag. Early adopters pay not only to buy, but also to install, maintain, and troubleshoot these devices. The cost grows when follow-up versions – often incompatible with the first – begin flooding the market. Brand updates and competing formats force users into cycles of replacement or abandonment.
  2. Most people, especially those with less disposable income or less interest in tech trends, choose to wait. These users let market forces shake out what works and what doesn’t. If a connected device offers only novelty, the market will strip it of value. It will disappear.
  3. Cost alone doesn’t determine survival. There’s another price to pay – consequence. Smart homes, like smartphones before them, introduce real risks. Many users begin with little awareness of what’s being collected, tracked, or sold. Over time, they learn – usually by proxy – about surveillance, breaches, and behavior profiling. The question becomes: once the public catches on, will smart homes go the way of the Segway or the smartphone?

Smartphone adoption offers a clear answer. Pew Research data shows that over 97% of the population now owns a smart mobile device (Pew Research Center, 2018). Awareness of surveillance or security risks has done little to slow this trend. Most users, even when informed, are unwilling to give up the convenience.

Expense and consequence alone do not stop adoption – they refine it. Together, these factors help shape a powerful, three-tier form of market regulation: caution, value, and backlash. This framework aligns with Lawrence Lessig’s Code 2.0, where market forces are listed as one of four primary regulators of digital behavior (Grimmelmann, n.d.).

That’s why the smart ladle, as ridiculous as it sounds (and it does), still holds conceptual value. Build the device, release it into the world, and let the market decide whether it earns a place in people’s homes.

Ms. Hill made the same mistake I once did – judging the technology in isolation. Her experiment overloaded a home with devices, not for quality of life, but for quantity of data. In trying to learn how the tech collects information, she buried her household in tools designed more for novelty than necessity. No surprise it became a frustrating experience. That setup was destined to fail. It’s like blaming a hammer for a splintered board or a crooked shelf.

At time of writing, smart appliance adoption stands at 14%, with forecasts placing it near 22% within the next four years (Statista, n.d.). These aren’t explosive numbers, but they suggest gradual acceptance. Most people, like me, don’t live in sensor-saturated homes. My setup includes only a few smart devices – each chosen with purpose. Despite the hype, the backlash, and the headlines, buyers continue voting with their wallets.

If that trend holds, Ms. Hill’s conclusion may be less a warning and more a moment of early frustration. Novelty will fade. Utility will remain.

References

Hill, K. (2018, February 7). The house that spied on me. Gizmodo. https://gizmodo.com/the-house-that-spied-on-me-1822429852

Pew Research Center. (2018, February 5). Mobile fact sheet. https://www.pewinternet.org/fact-sheet/mobile/

Grimmelmann, J. (n.d.). Internet law: Cases and problems (Version 41). https://internetcasebook.com/

Statista. (n.d.). Smart appliances – United States: Market forecast. https://www.statista.com/outlook/389/109/smart-appliances/united-states

Forced Preparedness?

Is There a Way to Force Self-Preparedness?

For all the talk about being ready, one reality remains – even the most passionate advocates for disaster preparation must admit that most of our time isn’t spent dealing with disasters. Life is hectic. Life is expensive. Most of us aren’t neglecting preparation out of ignorance or apathy. We’re prioritizing what seems urgent now, not what might be urgent someday.

So how can we push back against our tendency to get swept up in daily life? One of the best ways may be to get involved. When we take on responsibility for others, we often become more responsible for ourselves.

Fortunately, there are simple ways to start. One standout is the CERT program – Community Emergency Response Training. This national initiative, supported by the Department of Homeland Security and managed by local emergency teams, equips everyday people with the skills to respond to disasters in their communities. The training empowers volunteers to act during emergencies – but it also has a powerful side effect. It helps participants become more prepared in their own homes and lives (Department of Homeland Security, 2018).

CERT members are trained to respond effectively during disasters. They also provide support during community events, offering a sense of ongoing purpose and engagement.

When you stop trying to “go it alone,” you’re far less likely to keep pushing off emergency prep for “when I have time.” CERT is just one example of a no-cost, community-based solution – but the principle holds across the board. Take on a shared responsibility, and you’ll naturally become more prepared yourself when real calamities strike.

To learn more or find a program near you, visit ready.gov/community-emergency-response-team.

References

Department of Homeland Security. (n.d.). Community Emergency Response Team. Retrieved April 18, 2018, from https://www.ready.gov/community-emergency-response-team


Rotten Tornadoes

Does our search for blame hinder preparedness?

It’s a simple fact of human nature: when something bad happens, we want to know why. That isn’t necessarily a flaw. It might be what makes us human. Animals tend to care about what happened and how, but they don’t ask why. Humans do. That one question may be the reason we’ve advanced to the point of altering the planet on a scale comparable to supervolcanoes and meteor strikes.

It’s unfortunate, though, that our curiosity about why often brings along a companion – who. Who caused this? Who should have done something? Who do we blame? We may be powerful enough to reshape the Earth, yet we are still subject to the same planetary and cosmic forces that drive earthquakes, storms, and droughts.

Take this excerpt from an article on Hurricane Harvey:

Weather and climate don’t cause disasters – vulnerability does.
Perhaps counter-intuitively, this means that the widespread discussion as to whether the Hurricane Harvey disaster was caused by climate change or not becomes a dangerous distraction. (Kelman, 2017)

The opening line points right to “someone is at fault” for Hurricane Harvey. The problem is, WHO is at fault? This article is hardly unique – a google search of “disaster blame” turns up it and thousands more. It’s a bold take, and a familiar one. A quick search for “disaster blame” turns up thousands of articles just like it.

Blame is easy to assign. That doesn’t make it accurate, or fair. Where I live, still safely 100 kilometers from one of the deadliest chemical stockpiles on Earth, we often shake our heads at people caught in disasters. Why did they live there? Why didn’t they move? Why weren’t they ready?

Is that smugness justified? Are people foolish for living in coastal cities that get hit by storms? We say similar things about residents of tornado country. Or those in California, sitting precariously on the edge of the continent.

Do people in the developing world build shanty towns in dangerous zones because they don’t know better? Or is it because global systems – shaped largely by those of us in wealthier nations – leave them no better options?

It becomes a loop of questions with murky answers. None of them help much when disaster actually strikes.

I don’t have a clean answer. Not asking questions would certainly hinder our ability to adapt and learn. I just wonder if we spend too much time asking who failed instead of what failed. In a world full of forces we still don’t fully control, focusing more on the latter might prepare us better for the next blow.

References

Kelman, I., 2017, August 29. “Don’t blame climate change for the Hurricane Harvey disaster – blame society.” The Conversation


Move Your Butt or Be An Ash

On an individual level, fire preparedness is perhaps one of the simpler facets of survival awareness. The do-and-do-not list is fairly binary, and most homes have at least some form of protection – by code if not by intention.

In fact, Dr. Bradley’s Handbook to Practical Disaster Preparedness for the Family does not even devote a dedicated chapter to fire events.

Public spaces, however, are another matter. Procedures are again rather black and white. Exits are marked, extinguishers are usually available, sprinklers abound, and there are even maps in some buildings highlighting the quickest egress. Yours truly produced the various fire maps you’ll find tucked into the corners of hallways across the University of Kentucky’s campus.

Now add drills, classes, seminars, and signage. The question becomes: are we overexposed? Picture the following:

A smoke alarm blares. It’s three in the morning. You’re exhausted. Tomorrow is a big day. It’s cold and probably raining. Your professor couldn’t care less if you were up all night, and the last three alarms were false. Odds are this one is, too. Or maybe a small trash can fire smolders next door – harmless now, but in less than two minutes, the hallway could be impassable. Do you wait, gather up comfortable clothes and your phone before shuffling outside? Or do you just go back to bed? (Caskey, 2017)

Statistics suggest going back to bed is the best choice – until the one time it isn’t. Can anything be done to “pierce the fog,” as it were? Emergency authorities believe so. They’ve borrowed a technique from good storytelling: show, don’t tell.

In September 2010, the UK Fire Marshal’s Office launched the Don’t Be an Ash program and began staging live dorm room burn demonstrations at public events to raise awareness among students and staff. “Flashover” may be a dry term – a specific ignition temperature at which all combustibles in a space ignite at once – but watching it happen changes everything.

So – has it made a difference?

According to the University of Kentucky Campus Fire Log (2018), between January 1, 2010, and December 31, 2014, there were 1,913 reported fire incidents on campus. Of those, four resulted in injuries. By comparison, from January 1, 2005, through December 31, 2009, there were 2,116 reported incidents – five with injuries. Running some basic analysis produces the following results:

  • Raw incident count dropped by 203 incidents, roughly 9.6%.
  • Injuries dropped from 5 to 4 – a small absolute difference, but still a 20% decrease in reported injuries.
  • Injury rate per incident dropped from 0.236% to 0.209%. That may seem tiny, but in relative terms, it’s a roughly 11.4% improvement in safety per incident.

While there are of course many unexplored factors affecting incident and injury rates, these results suggest that showing, not just telling, may improve engagement. Still, balance is key. After awareness comes action – and it’s crucial that people know what the right actions are when the alarm goes off.

References

Caskey, D. V. (2017, January 14). Project 2 – Scene Depiction. Retrieved March 29, 2018, from https://www.caskeys.com/dc/project-2-scene-depiction-project/

University of Kentucky. (2018, March 28). Campus Fire Log. Retrieved March 28, 2018, from http://ehs.uky.edu/apps/flashpoint/incident_log.php

Preaching Purity

That’s not a groundbreaking question – but when the faucet fails, it’s one you’ll be glad you asked yourself.

“Water, water, everywhere and not a drop to drink.” Most of us hear that and picture floating helplessly on a lost ocean raft, or imagine the perils faced by early explorers as they sailed into parts unknown.

Fortunately, the likelihood that any of us will encounter such a situation is comparable to lottery odds. Unfortunately, the so-called freshwater around us often isn’t much more potable than seawater – albeit for different reasons – and can be every bit as dangerous. So, what will you do when the tap stops flowing?

Consider this simple challenge from Dr. Arthur T. Bradley’s Handbook to Practical Disaster Preparedness for the Family:

“Heavy rains have flooded the nearby water treatment facility, introducing two dangerous pathogens (Giardia and Shigella) into the water supply. Local authorities have issued an order to use bottled water and boil tap water. The rains are expected to continue for the next five days. How will you provide clean drinking water for your family? Do you understand the risks these pathogens pose?” (Bradley, 2012, pp. 3–22)

Right away, you’ll notice this scenario is actually a best-case version of disaster. The water is contaminated – but it’s still flowing. We can assume utilities are functioning. So, you boil what you need and move on.

Now let’s add a twist: What if the local river floods? Your home isn’t in the flooded zone, but your power is out and bottled water is no longer an option. Would you still know what to do?

The truth is, there’s no single perfect answer. But there are many workable solutions with varying levels of convenience, cost, and reliability. It may be a worn mantra, but again – it all starts with education. Take time to study different purification methods and available products. Then choose the combination that best suits your needs.

Storage

Stockpiling water has the clear advantage of instant availability. Unless your stockpile floats away with the storm, you’re covered. The downside is storing enough for long-term use is logistically difficult, and water does indeed have a shelf life.

“Unless treated with a water preserver, it must be poured out and refilled about every six months” (Bradley, 2012, p. 3–23).

Bradley dedicates an entire chapter to water storage, making it clear that tossing a few jugs in the garage is not a sufficient plan (Bradley, 2012). Still, this shouldn’t stop you from storing what you can if trouble is forecast.

“Regardless of your approach, one thing holds true. If disaster is imminent, store as much water as possible. If you don’t have enough water containers, fill bathtubs, buckets, pots, barrels, and anything else you have available. Remember water is not only used for drinking and cooking, but also hygiene and sanitation” (Bradley, 2012).

Even if you do have enough containers, I would argue you should still fill everything else you have. More is more.

Again, no single solution fits every family or every situation. What matters is that you take time to make basic preparations – and keep an agile mindset to adapt when needed.

References

Bradley, A. T. (2012). Handbook to practical disaster preparedness for the family (3rd ed.). Lexington, KY: Arthur T. Bradley.

Back to Basics, Storage vs. Procurement

It’s a simple question on the surface: is it better to spend more effort stockpiling basic needs, or preparing to acquire them on site?

Some refer to this dilemma as “Butter vs. Bullets.” I prefer “Apples vs. Ammo.” Unfortunately, the mercurial nature of disasters quickly complicates things. Just for the sake of argument, let’s focus on water. Nutritional needs might be met through hunting (a debate all its own), or even ignored for a short while – but water is neither easily procured nor safely ignored.

Think about the role water plays in your daily life. Drinking is only the start. Sanitation, cooking, hygiene – every aspect of survival leans on a reliable source. Filtering water may work in a wilderness survival context, but disasters introduce a whole different set of variables.

Take this challenge posed by Dr. Bradley in Handbook to Practical Disaster Preparedness for the Family:

Heavy rains have flooded the nearby water treatment facility, introducing two dangerous pathogens (Giardia and Shigella) into the water supply. Local authorities have issued an order to use bottled water or to boil all tap water. The rains are expected to continue for the next five days. How will you provide clean drinking water for your family? Do you understand the risks that these pathogens pose? (Bradley, 2012)

At first glance, the solution seems straightforward – just keep boiling water. Yet any storm powerful enough to flood a treatment plant could easily knock out power as well, and with it your electric stove or easy access to fuel. What then? Could you come up with an alternative? Even if the answer is yes, having a small cache of water to bridge that gap would prove invaluable.

This is another example of why a well-rounded preparedness mindset is far more practical than focusing entirely on one strategy. A garage full of water and food isn’t feasible for most people to maintain. At the same time, developing the skills to provide for every need on site is equally unrealistic. The smartest course? A balanced approach – learn basic survival skills, and keep some fundamental supplies on hand. That combination might turn out to be the most resilient choice of all. Survival skills and keeping some basic supplies on hand, might prove to be the most beneficial.

References

Bradley, A. T. (2012). Handbook to practical disaster preparedness for the family. Lexington, KY: Arthur T. Bradley page 50.

Dramatic or Deadly

Is it Fair to Preemptively Assess Threats Due to Student Expression?

Attacks on schools and other vulnerable public venues might not be happening more often – but they’re definitely drawing a bigger share of public attention. Whether it’s through media saturation, social media amplification, or our collective fear, the presence of violence in public consciousness has become hard to ignore.

At time of writing, another deadly mass shooting had just unfolded in Parkland, Florida. The motives behind these attacks are all over the place – ranging from personal vendettas to mental health struggles to ideological extremism. Still, most of them seem to have one thing in common: the perpetrator feels powerless.

Another heartbreaking similarity is the trail of missed warning signs. In so many cases, we’re left wondering why the red flags weren’t enough. Why didn’t authorities act? Why didn’t school administrators step in? Why didn’t peers say something? It’s tempting to assume incompetence or indifference, but the reality may be more complicated. At its core, our society operates on the principle of innocent until proven guilty – and that standard makes preemptive intervention extremely tricky.

Now let’s put adult threats aside for a moment. What happens if we start investigating every edgy piece of writing, every vaguely threatening comment, every social misstep from teenagers? Beyond the sheer logistical impossibility, there’s a deeper risk: in trying to prevent violence, we might strip away one of the last outlets for a teen in crisis – self-expression.

Those expressions aren’t always comfortable, popular, or even ethical. Sometimes they’re dark, inappropriate, or disturbing. Still, without them, we begin to erode the foundations of a society built on personal freedom.

Take this real-life example from an undisclosed northwestern university, cited in Freedom of Speech vs. Student Safety: A Case Study on Teaching Communication in the Post-Virginia-Tech World. During the final minutes of class, one student made a shocking comment:

“I think that the homeless should be shot and ground up for dog food because, after all, they are useless anyway.” (Kane, 1986)

Understandably, this upset several classmates. The adjunct instructor was torn. Ignore the comment and risk minimizing the distress of the class – or overreact and possibly traumatize the student who made it. There was no direct threat, no plan of action, just a horrific opinion. What’s the right call?

In the end, the situation was defused without official disciplinary measures. A friend of the course director – who was a psychologist – offered advice. The student was gently informed about the broader impact of his words and, after some reflection, apologized to the class.

It worked out peacefully, this time. Of course, not all scenarios will resolve so neatly. Still, most can. And that leads to the hard question: would it have been fair to treat that student as a threat? What would he have learned from a more aggressive response?

There’s no one-size-fits-all answer. Yet it’s worth asking. Because while student safety is paramount, the way we preserve that safety matters. Preemptively labeling expression as threat might reduce risk – but it also risks flattening nuance, silencing those who already feel unheard, and undermining the very freedoms we claim to protect.

References

Kane, P. E. (1986). The New World Information Order and Freedom of Communication: The Communication Case for the New World Information Order. Free Speech Yearbook, 25(1), 69–69. https://doi.org/10.1080/08997225.1986.10556064

Wise Buys? Survival Kits Online

It’s no secret that survival is big business. Widget makers are quick to offer various takes on preparedness for your dime – even my transport choice, Chevy Avalanche, offered a “Zombie Apocalypse Approved” edition. Unfortunately, that last example is also a clear sign of buyer beware. In fairness, the vehicle in question is already an off-road capable platform designed to accommodate a variety of needs. But if you were expecting any upgrades for the extra ~1000USD price tag, prepare to be underwhelmed. Dashboard plaques and a green exterior accent are all she wrote.

So it goes with just about anything or anyone touting a quick and easy solution to preparedness. One of the more common market ploys are kits promising to outfit a family of X size for X days with all basic needs and comforts.

Note these kits make a lot of assumptions (as they must). There is almost no accommodation for disabled or special needs people. They are also by nature very generalist. Your own location and proclivities may render them less useful. Finally, as pointed out here, Caskey, D. V. (2018, February 15). Instant Survival – Just Add Money. Retrieved February 15, 2018, from https://www.caskeys.com/dc/instant-survival-just-add-money/ they are also absolutely no substitute for basic planning and awareness. That said, coupled with a bit of know-how and forethought, a well-appointed kit could take some of the hassle out of preparedness. Below are a few for your consideration. Remember, always be aware of your situation!


Wise Survival Backpack – 69.99USD

This backpack based kit is designed to accommodate a single person’s general needs for ~five days in an outdoor setting.

Amazon. (2018, February 01). Wise Foods 5-day Survival Back Pack Red. Retrieved February 14, 2018, from https://www.amazon.com/Wise-Food-5-Day-Survival-Backpack/dp/B00ZX3ALQM

  • 32 servings of Gourmet Entrees
  • Apple cinnamon cereal, portable stove including Fuel tablets
  • Ideal for emergency preparedness for tornados; hurricanes; wildfires; floods; etc. All items are packed in camo nylon backpack
  • 5 x 4.227 fluid ounce water pouches, portable stove (including 24 fuel tablets), stainless steel cup, squeeze flashlight, 5-in-1 survival whistle, waterproof matches, Mylar blanket, emergency poncho and playing cards
  • 42 piece first aid and hygiene kit (including 37 piece bandage kit, N95 dust mask, pocket tissues, 3 wet naps and waste bag

Mayday Classroom Lockdown Kit – 69.95USD

Centered around a classroom emergency (active shooter, severe weather, etc.), this is a short-term kit primary concerned with first aid needs.

Systemax Corp. (2018, January 15). Mayday Classroom Lockdown Kit. Retrieved February 14, 2018, from https://www.globalindustrial.com/p/safety/first-aid/c-e-r-t-kits-and-supplies/classroom-lockdown-kit?infoParam.campaignId=T9F&gclid=Cj0KCQiA_JTUBRD4ARIsAL7_VeXcmH6-EHOUL3Yy9T7B_yogjB40UaFJxMH63qISQ4V4i6AGovXEZQEaAtiiEALw_wcB

  • (3) 3600 Cal. Food Bars
  • (30) Packs of Drinking Water
  • (1) Portable Toilet
  • (1) Standard Roll of Toilet Paper
  • (2) Toilet Disinfectant
  • (100) Moist Towelettes
  • (4) Toilet Liners
  • (1) AM Radio w/Batteries
  • (1) Whistle
  • (1) 10 yd. Roll Duct Tape
  • (1) Large Mylar Blanket

4-Person 3-Day Deluxe Emergency Kit 139.96USD

Family oriented general kit designed to supply basic needs for ~three days. As is somewhat common for family sized kits, it comes packaged in a watertight bucket.

Home Depot. (2018, January 20). Ready America 4-Person 3-Day Deluxe Emergency Kit in a Bucket-70395. Retrieved February 14, 2018, from https://www.homedepot.com/p/Ready-America-4-Person-3-Day-Deluxe-Emergency-Kit-in-a-Bucket-70395/301024622?cm_mmc=Shopping%7CTHD%7Cgoogle%7C&mid=sF2BZPNpH%7Cdc_mtid_8903tb925190_pcrid_111415680425_pkw__pmt__product_301024622_slid_&gclid=Cj0KCQiA_JTUBRD4ARIsAL7_VeXz6h3ThY9-VZd-WDnusoIy_kQBFsQxVP0v_llHiJ87MlMfCa6ulkQaAj8UEALw_wcB

  • four 2400-calorie emergency food bars (5-year shelf life)
  • 4 liters of boxed emergency water (5-year shelf life)
  • 4 emergency ponchos
  • 4 survival blankets
  • four 12-hour emergency light sticks
  • 4 pairs of nitrile gloves
  • 4 Niosh N-95 dust masks
  • 4 packets of pocket tissues
  • one emergency whistle
  • one pair of leather work gloves
  • one multi-function tool
  • one roll of duct tape (10 yards)
  • 4 safety goggles
  • 3 bio-hazard bags
  • 12 pre-moistened towelettes
  • one 107-piece first aid kit
  • one emergency Power Station (flashlight / AM-FM radio / siren / cell phone charger)
  • one 5 Gal. bucket and one bucket lid

Any inconsistent grammar or errors one might find in the product lists (and there are many) are due to direct quotation. I have left them in place to further emphasize the point of awareness – quality control is nominal when a quick buck is on the line. Would you trust your life to an entity that doesn’t proofread its own bylines? YOU must decide how to best allocate resources and time to be ready for what comes.

Instant Survival – Just Add Money

Has disaster preparedness become too commercialized?

One of the more difficult issues with survival in disasters is communication and sphere of awareness. Common individuals from the public are oft accused of giving little thought or concern about preparedness until after the event – obviously much too late. Is it even fair to expect more? John and Suzy Q. have enough to worry about conducting their everyday lives. To them, the notion of preparing to survive in worst case scenarios smacks of cardboard plaques claiming the end is near.

Perhaps playing on both this and the sensational fear that follows every disaster event, some commercial products have arisen promising preparedness in a box. Just pay the freight, and never give a second thought while the kit gathers dust in some forgotten corner.

This is severe folly that could potentially cost more lives than having no preparations at all. An overconfident family may opt to ride out an incoming hurricane or shun help until it is too late to do so. Dr. Arthur Bradley, author of Handbook to Practical Disaster Preparedness for the Family summarizes the concept perfectly.

Bradley, A. T. (2012). Handbook to practical disaster preparedness for the family. Lexington, KY: Arthur T. Bradley, Kindle Location 482.

We all love one stop shopping. It’s easy, and there’s little thought required. Capitalizing on that line of convenience thinking, several companies now offer prepackaged disaster preparedness kits. Most are stored in airtight buckets or easy to carry backpacks-both good ideas. If you read the the retailer websites, you might be convinced that preparing offers nothing more than forking over $99 and finding a shelf on which to store the bucket of goodies.

Through an exhaustive step by step analysis, Dr. Arthur goes on to put a commercial family of four survival kit up against a real world east coast hurricane scenario. His conclusion was not surprising. The kit fell woefully short of meeting the most basic needs.

Bradley, A. T. (2012). Handbook to practical disaster preparedness for the family. Lexington, KY: Arthur T. Bradley, Kindle Location 529.

The bottom line is that, upon further analysis, the bucket DP kit falls far short of meeting your family’s post-hurricane needs. Test this kit against other scenarios, such as a winter storm, terrorist strike, or widespread blackout. No doubt you will agree that it does little to improve your chance of survival, let alone make the situation more tolerable.

The simple truth is that disaster preparedness is not unlike any other personal skill. It is not particularly complex, but does require a nominal expenditure of thought and effort. You can order today, but it’s of little use unless you act now.

Nature Will Out

Imagine if you will, having lunch at a local bistro with your best friend. Suddenly, you find yourself thrown flat among shards of glass, wood, and twisted metal. Your ears ring, vision blurs, and you can barely breathe. You realize there’s been an explosion of sorts, and you’re lucky to be alive.

Your friend is not so lucky. They lie a few feet away, a viscous gash running through their neck all the way to the spine. He or she spasms, choking, and gagging even as they bleed out. You are watching your friend die.

Just as the awful realization hits, your sphere of awareness begins to expand. Others are in similar disarray. Some are like you, others badly hurt, and some like your friend are clearly terminal if not dead already.

Soon enough a car veers toward the building’s remains, screeches to a halt, and its occupants rush inside. They claim to be off duty EMT personnel. One of them shuffles toward you, yells “yellow”, and orders you to wait outside. They then give your friend a cursory glance and declare “black”, moving on without another look. It doesn’t take any medical or emergency training to know your friend, your still living friend, has just been given up for dead.

Could you stand by, coolly detached, knowing this was done for the greater good? Now imagine thousands of other mental taxing disaster scenarios that may be thrust upon an unprepared John Q., ask a similar question, and picture the result. During a functional chemical weapon exercise performed in Cincinnati, the human disaster factor is summarized perfectly in this caption.

FitzGerald, D. J., Sztajnkrycer, M. D., & Crocco, T. J. (2003). Chemical weapon functional exercise–Cincinnati: observations and lessons learned from a “typical medium-sized. citys response to simulated terrorism utilizing weapons of mass destruction. Emmitsburg, MD: National Emergency Training Center. Page 209, image caption:

For decontamination and triage to be effective and efficient, early control of victims is essential. In a real event would the responding units be as effective at rapidly organizing the crowd of hysterical “victims” into an orderly decontamination line?

Conclusions were speculative at best, but researchers speculated in a real emergency the the herding cats principal would be likely to hinder response efforts.

FitzGerald, D. J., Sztajnkrycer, M. D., & Crocco, T. J. (2003). Chemical weapon functional exercise–Cincinnati: observations and lessons learned from a “typical medium-sized. citys response to simulated terrorism utilizing weapons of mass destruction. Emmitsburg, MD: National Emergency Training Center. Page 209:

Lessons learned. Anticipate initial difficulty in establishing scene priorities. In this scenario, the engine company that responded first was met by a stream of screaming victims, which distracted the company from initial scene evaluation. The four firefighters were pressed to gain rapid control of the situation, activate the incident command system, and begin gross decontamination. It remains unclear whether a small cadre of firefighters could gain control so efficiently in the setting of an actual terrorist event. It also remains unclear whether
such crowd control would be possible in the setting of 5,500 victims, as in the Tokyo incident. However, it is likely that the majority of people in a large event
would disperse prior to arrival of first responders, and that those remaining would comprise individuals too sickened to escape.

In short, to expect an organized triage of victims in any sizable incident is something of a pipe dream. Response personnel (and victims themselves) must prepare to not only handle the disaster itself, but to deal with the inevitable, mercurial human nature thereafter.

Preparation Profiling

Racism is a problem. Let’s get that out-of-the-way right away. But as with any real problem, injecting it as a narrative into every known facet of society or life rarely produces any working solution.

Moreover it seems, that due to the political sensitivity of racism as a topic, scientific method no longer applies as a ground rule of discussion. As a primary example, let us look at the opening quotation of an article published by The Eastern Sociological Society: Priming Implicit Racism in Television News: Visual and Verbal Limitations on Diversity.

See Sonnett, J., Johnson, K. A., & Dolan, M. K. (2015). Priming Implicit Racism in Television News: Visual and Verbal Limitations on Diversity. Sociological Forum, 30(2), 328-347

We highlight an understudied aspect of racism in television news, implicit racial cues found in the contradic-
tions between visual and verbal messages. We compare three television news broadcasts from the first week
after Hurricane Katrina to reexamine race and representation during the disaster. Drawing together insights
from interdisciplinary studies of cognition and sociological theories of race and racism, we examine how
different combinations of the race of reporters and news sources relate to the priming of implicit racism. We
find racial cues that are consistent with stereotypes and myths about African Americans
even in broadcasts
featuring black reporters
but which appear only in the context of color-blind verbal narration. We conclude
by drawing attention to the unexpected and seemingly unintended reproduction of racial ideology.
In fairness, the article does not present itself as research topic, but still is written from a standpoint of unequivocal truth to reference. The conclusion is simply accepted, and then supported with the author’s findings. That is a scary precedent to set.
In further fairness, I’ve just described the lion’s share of writings – certainly most of my own. Throwing rocks from a glass house isn’t the point of this writing. I would simply ask a question about the directed efforts: Is our quest for harmony a hindrance to handling disasters?
In ~twenty pages, not once did Sonnett, Johnson or Dolan mention any of the staggering logistic issues Hurricane Katrina presented and how this alone might have affected a view of racial bias. Hurricanes are not people. They don’t care about race. They DO care about class however, as it just so happens the poorest members of society are also the least mobile, the most vulnerable, and in the aftermath, justifiably the most desperate. Naturally class disparity is a topic all its own, but one that goes far beyond this writing.
Efforts to politicize Katrina aren’t hard to find: Teme’ (2009-2014), If Good Is Willing and The Creeks Don’t Rise (2009), Trouble The Water (2008), and When The Leeve’s Broke – A Requiem In Four Acts (2006) are all a cursory Google search away. Analysis of the logistical efforts, finances, water tables, meteorological phenomenon (that don’t also lapse into politicized climate change discourse) are a bit harder to come by.
The later is where I found need to question our directed efforts. Racial equality is a worthy discussion and has its place. But should it really be the primary focus of disaster aftermath? Perhaps we should make a little room for discussion about real preparation, mitigation, and response.

The Prepper Underground

Think you’re ready for anything? VivosxPoint would like a word with you. Why bother stocking piling supplies, training yourself, or being aware of the situation at all? Vivos promises Life Assurance – for a price.

This author must ask right away, exactly how would a “life assurance” guarantee work? By definition, you’re not likely to have unsatisfied customers. Vivos seems to believe the solution is to lease bunkers in the long abandoned Fort Igloo. Welcome to the xPoint Survival Community (http://www.terravivos.com/secure/vivosxpoint.htm), brainchild of founder Robert Vicino.

Dobson, J. (2016, October 07). Inside the World’s Largest Underground Survival Community. Retrieved January 24, 2018, from https://www.forbes.com/sites/jimdobson/2016/10/07/exclusive-look-inside-the-worlds-largest-underground-survival-community-5000-people-575-bunkers/#4925f5e816e4

The massive complex is spread over a sprawling and remote, off-grid area of approximately 18-square miles. It is strategically and centrally located in one of the safest areas of North America, at a high and dry altitude of 3,800 feet, relatively mild weather and well inland from all large bodies of water. It is over 100 miles from the nearest known military nuclear targets.

Additionally, Vivios promises 24-7 security, monitoring, and for those willing to pay, all amenities provided. Do it yourself types are welcome too. Just sign on for the ninety-nine year bunker lease and season to fit. All for the low, low price of 25K USD.

If any of this rings sarcastic, it’s not by accident. I’m being generous opining the practicality is questionable. At best. The very slogan found on Vivos own site borders on hilarity.

The Vivos Group (2009). Vivos xPoint Survival Community. Retrieved January 24, 2018, from https://www.forbes.com/sites/jimdobson/2016/10/07/exclusive-look-inside-the-worlds-largest-underground-survival-community-5000-people-575-bunkers/#4925f5e816e4

When it comes to survival, it is not how close or the proximity of your shelter that matters; what does matter is the survivability!

Sure. For when the end comes, no doubt getting from a Manhatten loft or an LA suburb to your bulletproof bunker in the nation’s breadbasket won’t be an issue at all.

Survival comes in many forms. Awareness. Training. Equipment. Yes, shelter. Sadly, even a bit of luck at times. A fortified pillbox in what is to most of us the middle of nowhere sounds great if you can afford it, but does little to fulfill basic needs in a real disaster. After all, you have to live long enough to get there first. Might I suggest a bit of free CERT training and keeping some basic needs on hand? You won’t get a Life Assurance guarantee, but you might get a better assurance on life.

Pragmatic Preparations

Disaster preparation is an extensive and potentially expensive business. Distilled to materials alone, nearly any advice on how to stock for the unexpected tends to include lengthy material bullet lists. Comprehensive lists might look great on paper, but are they realistic compared to the limits of a typical families’ personal resources?

Let’s look at a single item as suggested in CERT UNIT 1: DISASTER PREPAREDNESS
PARTICIPANT MANUAL, 1-22: Water.

Keep in mind that a normally active person needs to drink at least 2 quarts of water each day. Hot environments and intense physical activity can double that requirement. Children, nursing mothers, and ill people will need more.
Store 1 gallon of water per person per day (2 quarts for drinking, 2 quarts for food preparation and sanitation).*
Keep at least a 3-day supply of water for each person in your household.

Seems simple enough, until one begins to do the math. Following the above guidelines a family of four would need to keep twelve gallons of water on hand at all times, making sure to replenish the supply at regular intervals. Do you have the ten or so square feet needed to spare? Can your drywall-mounted shelves withstand one hundred pounds?

What about poorer families? Those who do not have space or money to spare on day-to-day resources, let alone extra water jugs? Moreover, these same families are typically more vulnerable to disasters in general. As an alternative, single step filtration straws could offer drinking water for a lesser expenditure of space, money, and time.

All the above merely covers water, arguably the easiest necessity to acquire. I would suggest looking at all areas of disaster preparation not just from the disaster itself, but also from the standpoint of limited availability. This article lacks the necessary scope or research to back up the concerns presented, but I hope to invoke some discussion and further examination. Preparation guidelines tailored more to the limits of its target audience might be less than ideal, but they would be a vast improvement over the nothing that may result from more lofty expectations.

Learning From The Undead

Zombies, zombies, zombies… look about and you will find them permeating nearly every aspect of contemporary culture. I would honestly doubt a real Zombie invasion would provide so many sightings of our favorite shambling obsessions.

With that in mind, to find Zombies being exploited for any number of topics need nothing more than a cursory search. Survival tips are no exception.

BUDK is but one of many outfitter companies caught in the Zombie invasion. While their “tips” shown here might be an obvious ploy for sales, the ideas given are not entirely nonsense – be it wilderness treks or an urban blackout. Taken with a grain of water purifying iodine of course.

  1. Lifestraw Personal Water Filter – In any given disaster, water is an immediate and obvious need even the most sheltered suburbanite is aware of. Unfortunately procurement is not as forefront. Recommended storage of one gallon per day for each individual borders on impractical for many families. Purifying is the next best step, but even in the best of times it is a process the untrained would find rather enigmatic. A single step item that combines simplicity with compact storage is a great combination for busy families looking attempting preparations but unable or unwilling to devote a great deal of personal resources.
  2. Stormproof Matches – Another great item that satisfies a need most know of but few know about. The article makes a point to speak of durability, but the associated longevity might prove more important when an emergency kit long forgotten is suddenly forced out of mothballs.
  3. One Person Tent – Great for wilderness survival. For a family huddled around their NOAA radio, probably a nicety best left to more lavish budgets.
  4. Axe – I can’t see the value in the particular item advertised, but they aren’t wrong about the need for an axe or hatchet. Any outdoor or hardware supplier will have a more practical version on hand. But do make sure to get stainless steel.
  5. Bicycle – Can’t get them all right! Bicycles are fantastic, but for reasons outside the purview of disaster preparation. Sure, they’d have enormous value in a long-term situation, but bicycles won’t do anyone much good during those crucial aftermath hours.


Five tips, and three on the money? You could do worse learning how to stay alive from a writing about dead folks. Remember to take their (and my) advice in accordance with your own needs. Stay safe!

Zombie Letdown?

Was the ultimate conclusion of Dr. Marjorie Kruvand, and Dr. Fred B. Bryant’s case study of the CDC Zombie Apocalypse Campaign a fair assessment?

Dr. Kruvand and Dr. Bryant sought out to discover if the CDC’s now famous Zombie Apocalypse campaign produced positive results in disaster preparation. They reached a fairly straight forward conclusion: No.

Public Health Reports / November–December 2015 / Volume 130 – Page 662

Although the campaign garnered
substantial attention, this study suggests that it was not
fully capable of achieving CDC’s goals of education and
action.

With respect to the research and groundwork laid out in Dr. Kruvand and Dr. Braynt’s study, I must respectfully, but vehemently disagree. It is true that instantaneously quantifiable results did not see significant change vs. a control group. However, it is also true that a campaign established in 2011 continues to attract attention and discussion in 2018. This intangible result has even filtered its way into classrooms, now serving as the target metaphor in the very course this assignment was crafted for.

One might compare the CDC Zombies to the mascot of a sports team. He, she, or it has no short-term effect on the outcome of an individual game. Rather, the mascot serves as an emotional focal point for support efforts. In turn, those efforts may attract attention and resources in the form of greater financial influx, superior staff, and more player talent that ultimately translates to success on the scoreboard. So it is that while a single campaign alone may not have sent John Q. off to pack supplies, it can and has served as a proverbial lighting rod to education and public service alerts for the better part of seven years. Those intangible results may well be far more valuable in the long-term than a year of boosted preparedness statistics.